Reader

#fediverse posts

from Software and Tech

I recently caused myself a bit of a minor issue by installing some updates on the Keyboard Vagabond cluster. It wasn't a big deal, just some version number updates from a project called renovate that automatically creates pull requests when package versions that you use get updated. Doing this did trigger a restart on the redis cluster, which means that different services may need to be restarted because their redis connection strings get stale. I had restarted the piefed-worker pod, but the update didn't seem to stick and I didn't realize it.

I noticed the next morning that I wasn't seeing any new posts, so I figured the worker was stuck and, sure enough, I checked the redis queue and saw it stuck at ~53k items.

image

Piefed will stop publishing items to the queue when the redis queue reaches 200MB in size and return 429 rate limit http responses.

Solution: restart and then processing started, but I was wondering about pod scaling.

The thing about scaling the worker is that piefed scales internally from 1-5 workers, so vertical scaling is preferred over horizontal, especially since redis doesn't ensure processing order like Kafka does, so by adding a new pod, I could create a situation where one pod pulls a post create, the next pulls an upvote, but the upvote gets processed before creating the post. So normally, you wouldn't want to scale horizontally, but there is a use case for doing it: something gets stuck.

In the past, the queue had blown up due to one or more lemmy servers going down and message processing stalling. I solved that at the time with multiple parallel worker pods so that at least some of the workers would likely not get stuck. Doing something similar could help in this current case, where the first worker wasn't processing queues. Now, the ultimate item on the to-do list is that I should make that pod return redis connectivity as part of the health check so that it'll get restarted if redis fails. (I'll be doing that after this blog post)

My up until today current version of horizontal scaling was on cpu and memory usage, but I never hit those limits, so it never triggered. I was working with Claude on it when it introduced me to KEDA, Kubernetes Event Driven Autoscaling. https://keda.sh/. This looks like what I need.

Installation was pretty simple, https://keda.sh/docs/2.18/deploy/, you can use a helm chart or run kubectl apply --server-side -f https://github.com/kedacore/keda/releases/download/v2.18.3/keda-2.18.3.yaml and it takes care of it. I had Claude create a kustomization file:

---
apiVersion: kustomize.config.k8s.io/v1beta1
kind: Kustomization

namespace: keda-system

resources:
  - https://github.com/kedacore/keda/releases/download/v2.18.3/keda-2.18.3.yaml

patches:
  # Custom patches to change the namespace to keda-system to be consistent with my other namespace patterns
  - path: patches/clusterrolebinding-keda-operator-namespace.yaml
  - path: patches/clusterrolebinding-keda-system-auth-delegator-namespace.yaml
  - path: patches/rolebinding-keda-auth-reader-namespace.yaml
  - path: patches/apiservice-external-metrics-namespace.yaml
  - path: patches/validatingwebhook-namespace.yaml

And the patches aren't necessary, but they look like the below just because I want that namespace.

apiVersion: apiregistration.k8s.io/v1
kind: APIService
metadata:
  name: v1beta1.external.metrics.k8s.io
spec:
  service:
    namespace: keda-system

After that, there's a scaledobject in Kubernetes that you can configure:

---
# KEDA ScaledObject for PieFed Worker - Queue-Based Autoscaling

apiVersion: keda.sh/v1alpha1
kind: ScaledObject
metadata:
  name: piefed-worker-scaledobject
  namespace: piefed-application
  labels:
    app.kubernetes.io/name: piefed
    app.kubernetes.io/component: worker
spec:
  scaleTargetRef:
    name: piefed-worker
  minReplicaCount: 1
  maxReplicaCount: 2 
  cooldownPeriod: 600  # 10 minutes before scaling down (conservative)
  pollingInterval: 30  # Check queue every 30 seconds
  advanced:
    horizontalPodAutoscalerConfig:
      behavior:
        scaleDown:
          stabilizationWindowSeconds: 600  # Wait 10 min before scaling down
          policies:
          - type: Percent
            value: 50
            periodSeconds: 60
          selectPolicy: Max
        scaleUp:
          stabilizationWindowSeconds: 120  # Wait 2 min before scaling up
          policies:
          - type: Pods
            value: 1
            periodSeconds: 60
          selectPolicy: Max
  triggers:
  - type: redis
    metadata:
      address: redis-ha-haproxy.redis-system.svc.cluster.local:6379
      listName: celery  # Main Celery queue
      listLength: '40000'  # Scale up when queue exceeds 40k tasks per pod. Piefed stops pushing to redis at 200MB, 53k messages the last time it got blocked.
      databaseIndex: "0"  # Redis database number (0 for PieFed Celery broker)
    authenticationRef:
      name: keda-redis-trigger-auth-piefed

This will scale when 40k messages are in the queue, which should only happen when something isn't getting processed, and will scale up to a second pod only. So, in the event that a pod gets stuck, at least things should gradually be kept moving.

When I got to this point, I decided to implement my restart idea, but Claude gave a different suggestion to use the Celery worker's retries, so it added

- name: CELERY_BROKER_CONNECTION_MAX_RETRIES
  value: "10"  # Exit worker after 10 failed reconnects → pod restart
- name: CELERY_BROKER_TRANSPORT_OPTIONS
  value: '{"socket_timeout": 10, "socket_connect_timeout": 5, "health_check_interval": 30}'

A new startup probe, sure why not

startupProbe:
          exec:
            command:
            - python
            - -c
            - "import os,redis,urllib.parse; u=urllib.parse.urlparse(os.environ['CELERY_BROKER_URL']); r=redis.Redis(host=u.hostname, port=u.port, password=u.password, db=int(u.path[1:]) if u.path else 0); r.ping()"
          initialDelaySeconds: 10
          periodSeconds: 10
          timeoutSeconds: 5
          failureThreshold: 30

and it changed a few thresholds for checking liveliness, which I thought looked fine.

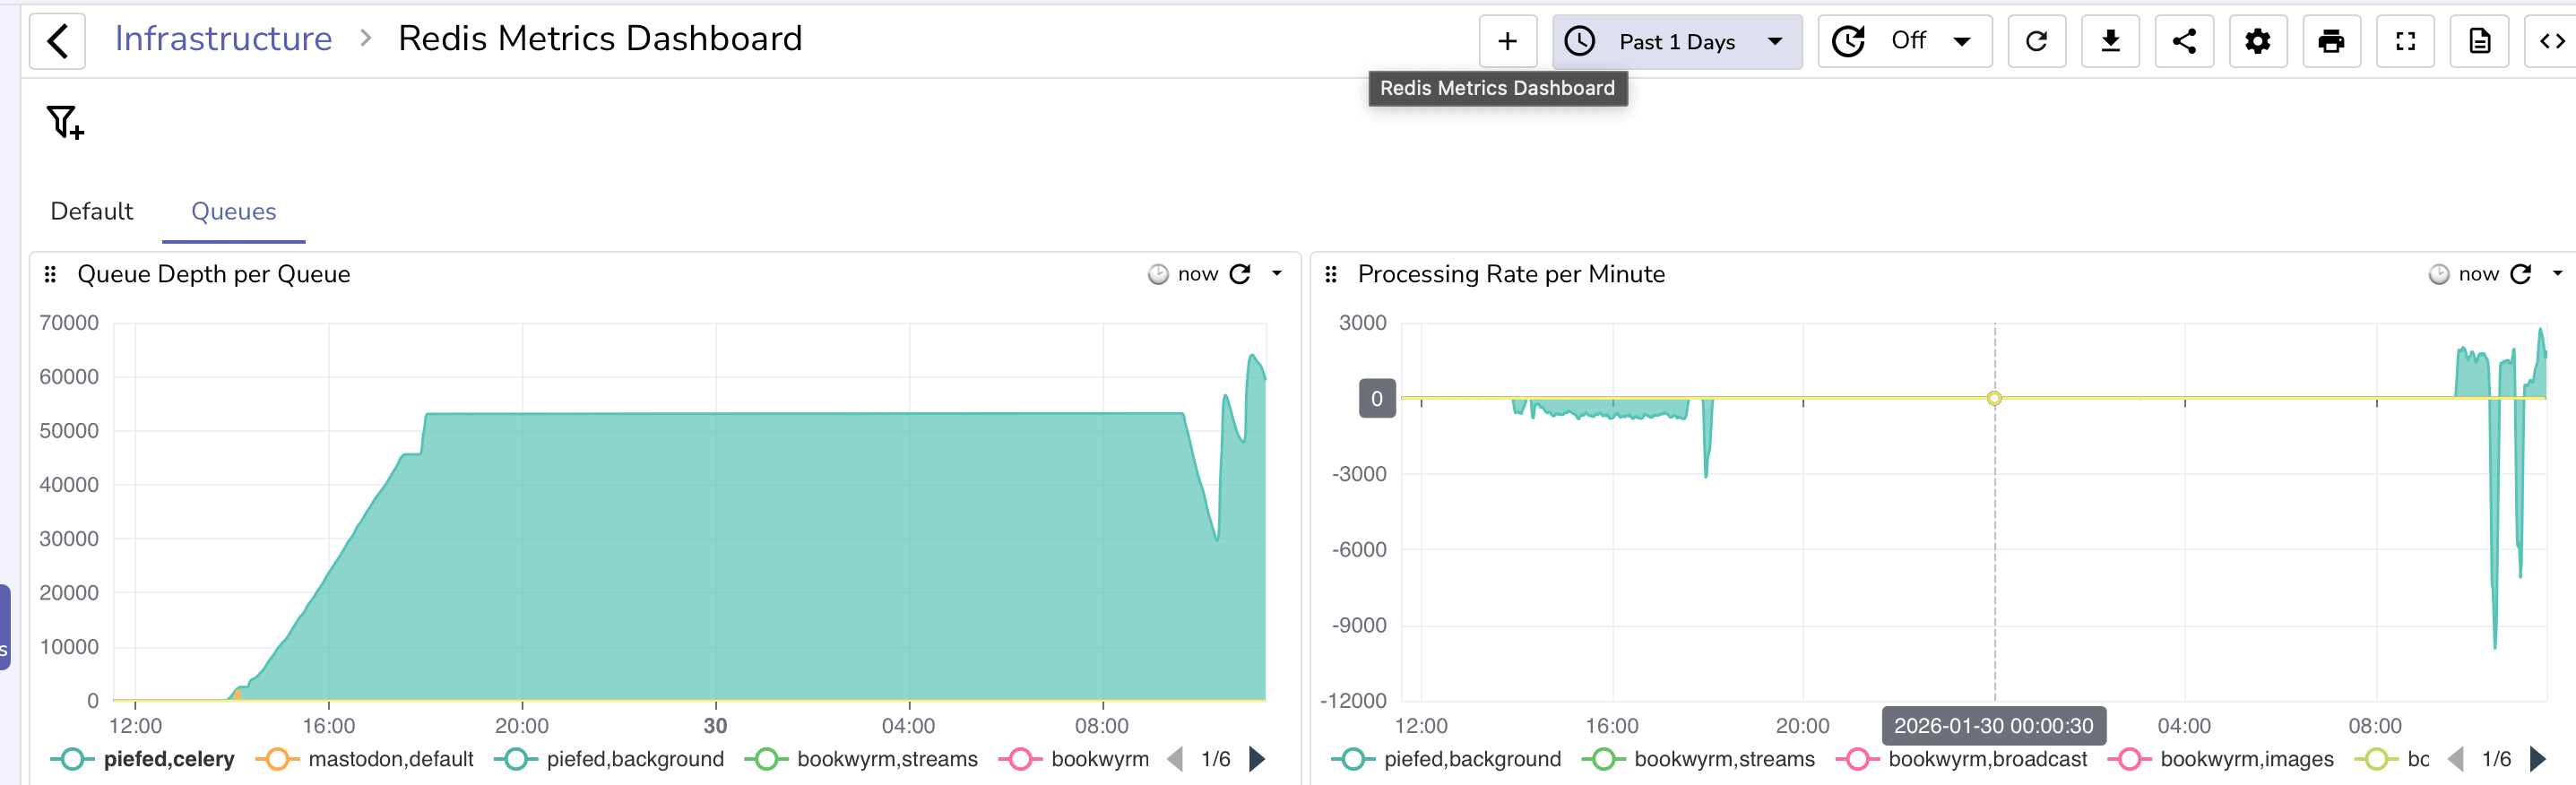
The current state of things is that once the number of records started going down, other servers started federating, which is the spike you see in the graph. There are now 3 web pods and 2 worker pods, vs the typical 2 web pods and 1 worker pod.

The good news is that after scaling out, the total max processed gradually rose from ~1.5k per minute to just under 3k per minute. Once the records fall below 40k and other servers are back to normal federation, things will go back to more normal levels, as a single worker is fine unless things stop and get backed up.

Good job on piefed for returning 429s to keep things from getting too crazy!

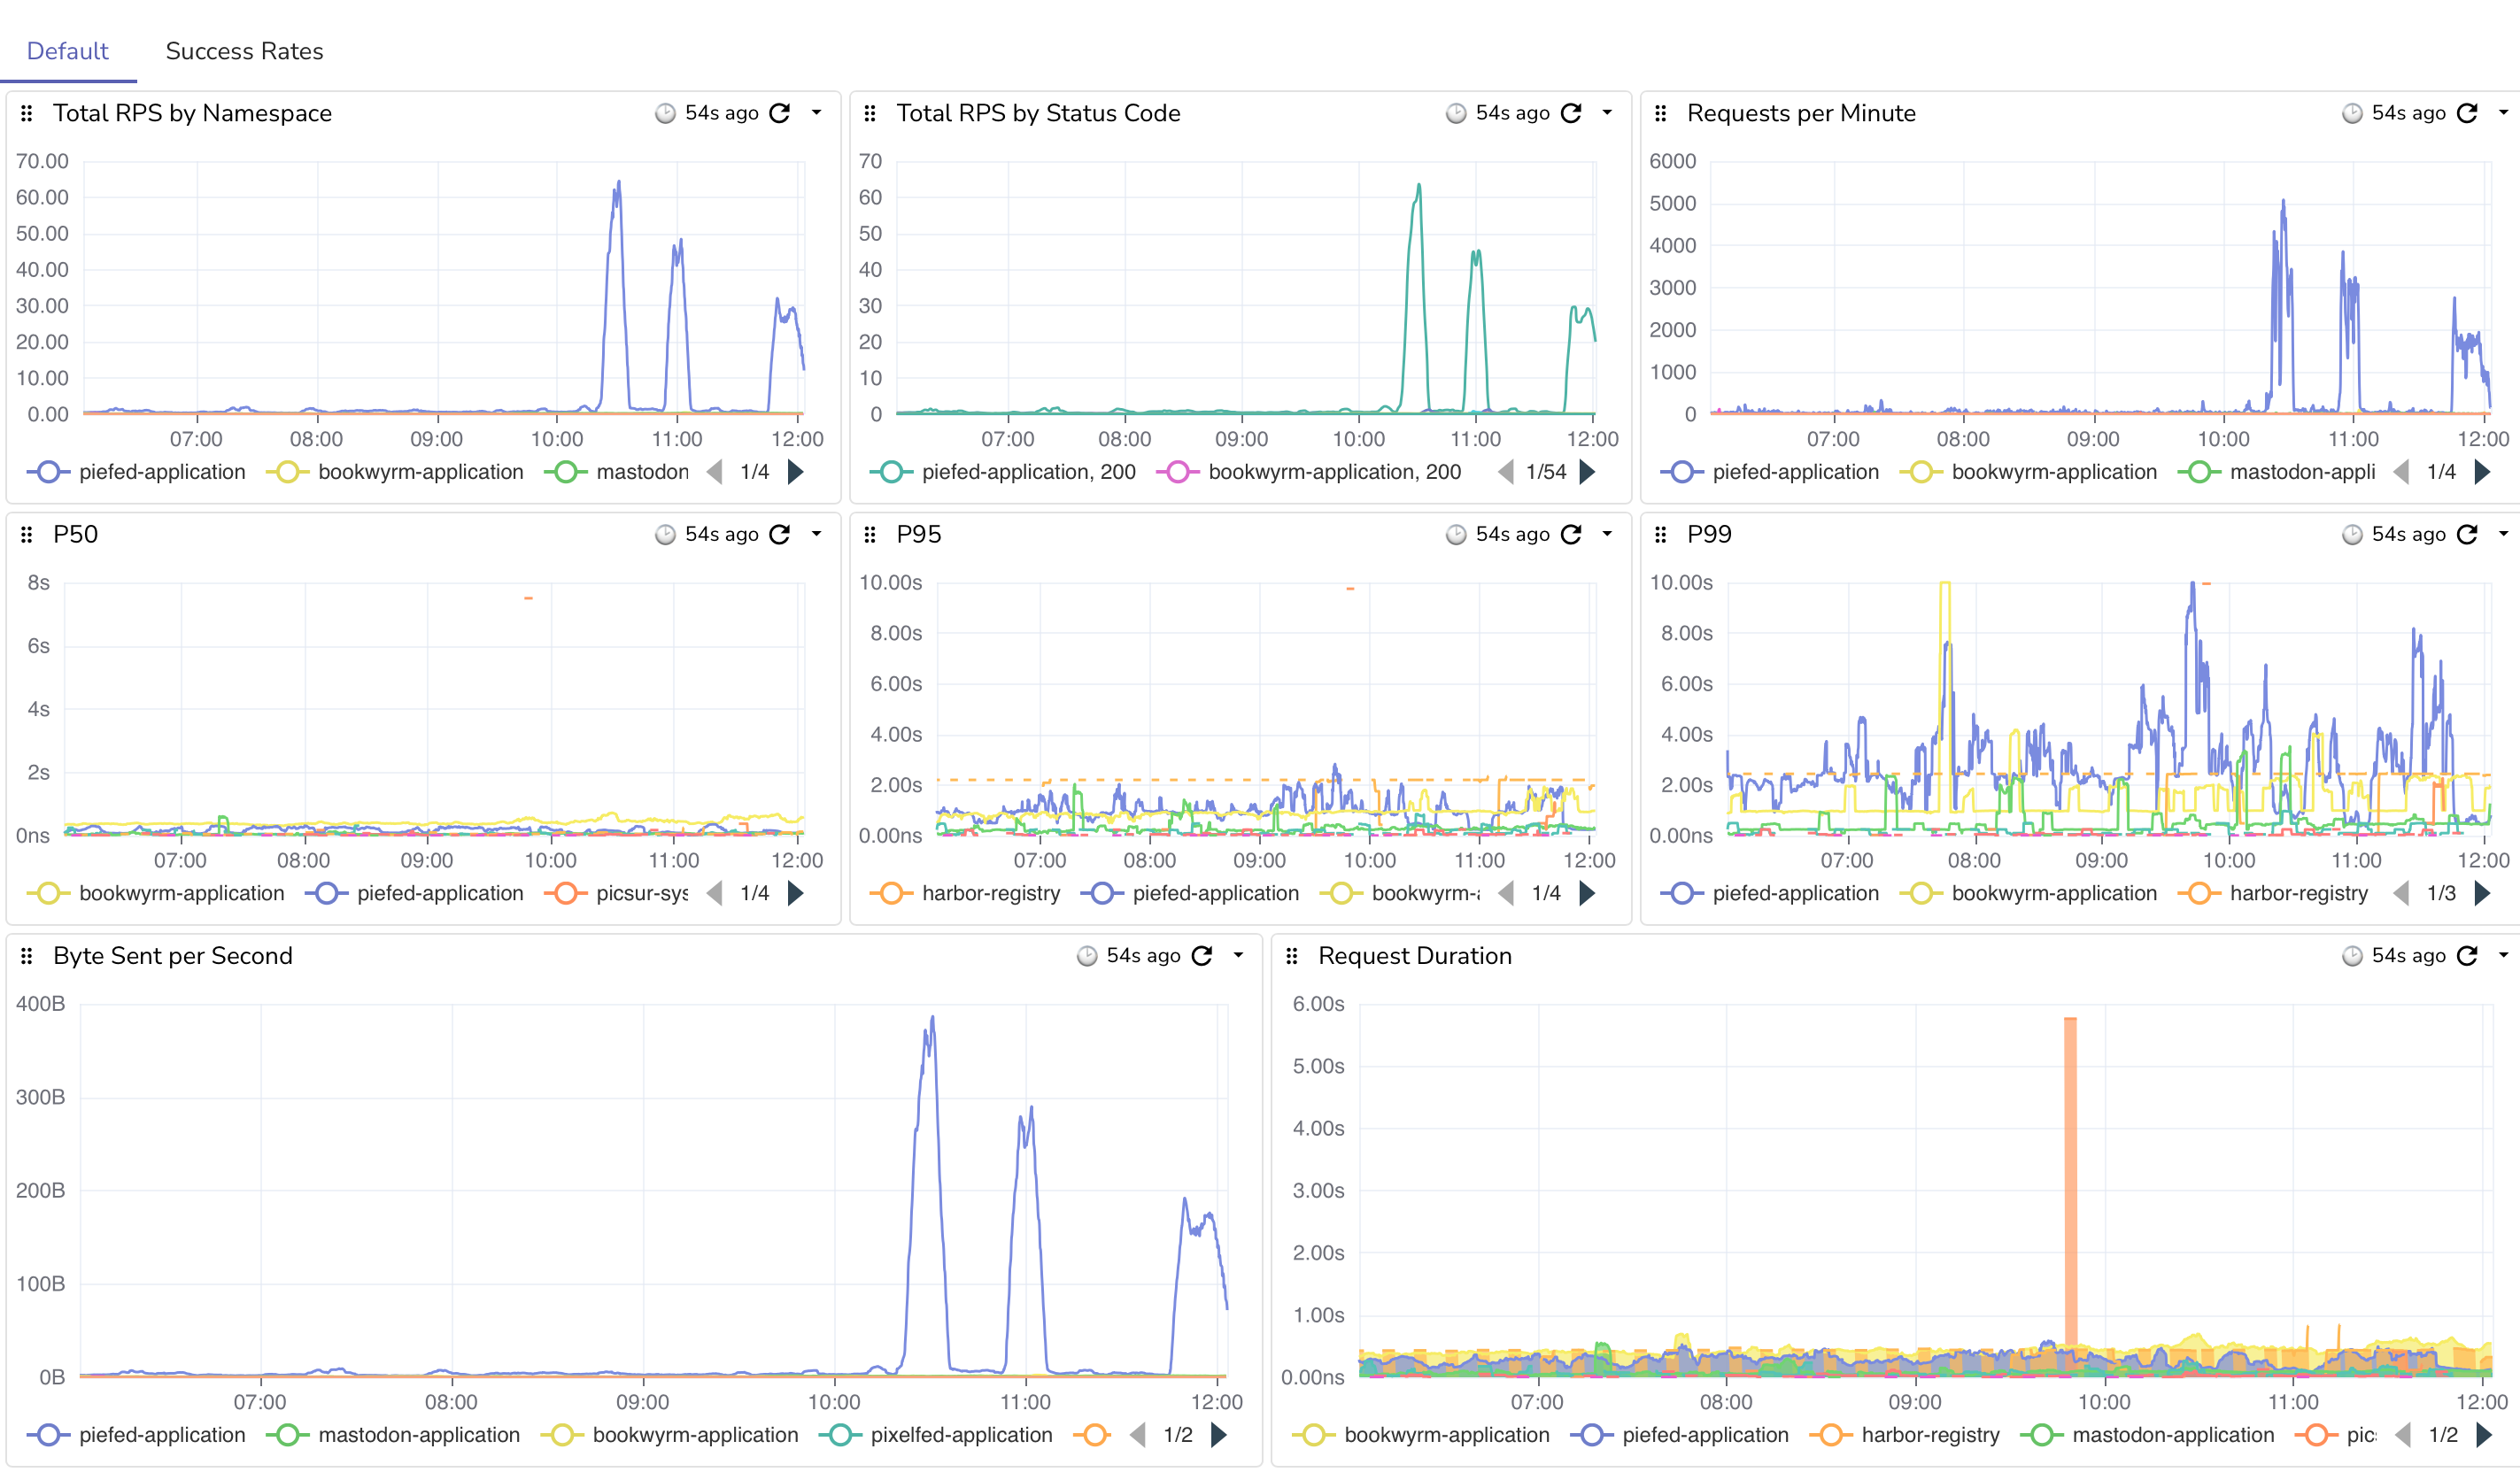
Here are the requests coming in. You can see big spikes once we stopped returning 429's. I do have some nginx rate limiting set up as well to keep things sane. image

Edit: I just ran into a fun thing while doing all of this. I ran out of WAL (Write Ahead Log) space on the storage volume. I gave it 10GB with expansion, so the primary db node started failing at 20.6GB in size. I just doubled the size of the WAL PVC and that resolved. lol.

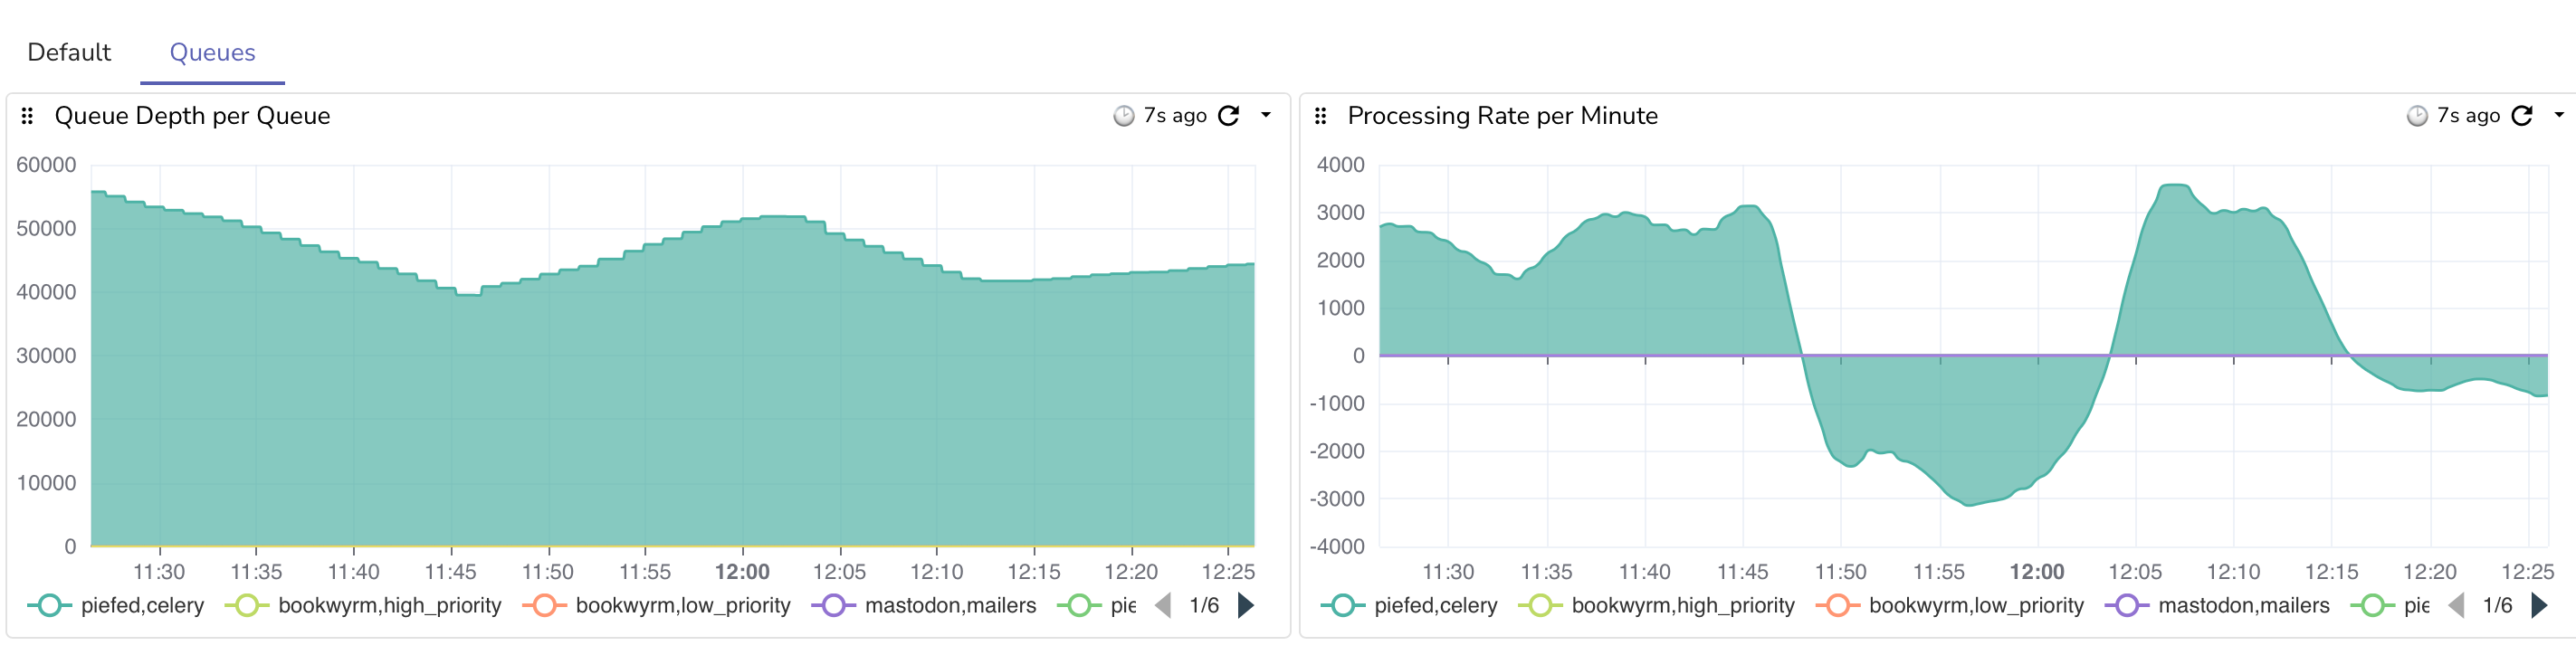
Edit 2: Fun waves as it hovers around the 40k threshold

#selfhosting #kubernetes #fediverse #yaml #keda #autoscaling #piefed #lemmy #programming #softwaredevelopment #k8s

 
Read more...

from Software and Tech

It started with a perfectly good and running kubernetes cluster hosting fediverse applications at keyboardvagabond with all the infrastructure and observability that comes with it. I've worked in kubernetes environments for a while, but lacked being able to see how everything comes together and what it means; I also wanted to host some fediverse software for the digital nomad community.

I followed a guide on bare metal kubernetes setup with hetzner (though you should definitely NOT change cluster.local like it says) with some changes, adjustments, and modifications over time to suite my scenario. While I was getting up and running with my 3 cluster VPS servers, I became nervous about resource usage. The applications that I host are currently more ram needy than cpu and the nodes with all of the applications were using ~12GB out of the 16GB available. I decided to make 2 of the 3 nodes worker nodes and have one control plane node. The control plane is the one that determines what the other nodes are doing and hosting. Put a pin in this, it'll come back later.

I also was able to migrate from DNS entries on exposed ports to Cloudflare tunnels and Tailscale for VPN access. This means that no one can try to input commands on the Talos or Kubernetes ports, as they're no longer exposed. You'd need to figure out the encryption key to be able to do it, but now it's even safer. Put a pin in that.

This has been very much a learning process for me in a lot of ways, and I hope that I haven't forgotten too much – it's funny how memory is. I've been taking a lot of notes and having claude/cursor draw up summaries that I leave lying around. It's funny how much sense your documentation makes until you come back 3 months later.

One of the issues that was in the back of my mind was that I had configured the Talos configuration launch kubernetes with the port number specified and I was using the external IP. This was a mistake, because it meant that the nodes were primarily communicating with each other externally rather than over the VLAN, or the internal network. Internal traffic still happened, as I believe that service to service communication would go via kubernetes to a local IP. However, I eventually got a broken dashboard working that showed me the network traffic by device, but it was all on eth0, the external ethernet, not the VLAN. I then checked the dashboards on the provider and it showed 1.8TB of internet usage. That's within my budget, thankfully, but way too much for a single-user cluster, as I had not yet announced the services as open to the public.

I wanted to get this working before going live, so I figured that I would start with n3, one of the workers. I have an encrypted copy of the Talos machine config, but couldn't decrypt it, so I copied n2, changed the IP to the internal 10.132.0.30, and applied...... I forgot to change the host name from n2 to n3.

No biggie, I'll change it and apply....timeouts. Tailscale is no longer connected to the cluster. I spent an hour trying to get access, working with Claude for ideas and work-arounds. No dice. I believe what happened was that in the confusion of 2 nodes with the same name, Tailscale was likely running on n3 and was no longer accessible and the weird state of things caused it to not be spun up on the other nodes. If it wasn't a weird state it was because at my scaling with redundant services and two nodes don't have the RAM available to handle everything from a failed node. But either way, I had to get back in to the cluster.

I went into the VPS dashboard and rebooted the server into recovery mode, wiped the drive, re-installed, and tried to re-join the cluster. This should have been fine as I ensure that there are 2 copies of all storage volume across the nodes in addition to nightly s3 backups. In hind-sight, I might have been better rebooting talos into maintenance mode. But it didn't rejoin the cluster. It turns out that I was missing a particular network configuration that would allow a foreign node to join. That doesn't happen automatically, there's allow-listing for the IP address and some other network policies that need to exist to allow it and I was missing one for one of the talos ports.

I need to get to the control plane node, n1. I rebooted into Talos maintenance mode and apply the new configuration, but it's logging that it can't join a cluster and that I need to bootstrap it to join. I guess that makes sense, it was the only control plane. I get it up and running and progressively add n3 and n2 and they re-join. I reinstall the basic infrastructure to get running and then let FluxCD restart all of the services. The majority boot up, but I notice that a couple of services are blank. No existing data.

I check the longhorn UI, which is what I use to manage storage, and I don't see a lot of volumes, but I see about 50 orphans.... Crap. All volumes were orphaned. When I put n1 into maintenance mode and then bootstrapped, I thought that longhorn would see the volumes and put them back with the services that they belonged to. However, when I redid n1, etcd, the part that manages cluster resources, was cleared and all that storage information lost who and what it belonged to. Learning is painful sometimes.

I tried to take a look at the volumes, but Talos is pretty minimal, so Claude made a pod with alpine and XFS (my file-system) tools that would attach a specific orphan volume, mount it, and try to look at the contents to see what it belonged to. Some things were fairly easy to identify, such as the WriteFreely blog, which is one of the first services that I loaded and uses its own SQLite database. I got that up and running. I also use harbor registry to be a mirror proxy and allow me to privately push my own builds – it was all 0s, or at least the first 100MB were. That's not a huge deal. The database volumes were intact, but I couldn't really get those running, so I'd have to re-create it.

I gradually got these services running and re-configured. Once Harbor is up, images should start getting pulled and cached. But redis failed to pull. That's weird.

But first let me get the database running with CloudNative Postgres. I got it up, but the database was empty, so back to looking at orphans. The tricky thing here is that a few applications have their own postgres databases, such as Harbor Registry. So instead of looking at the file structure I also had to find out what tables were there, but even when I found them, I didn't know which orphan belonged to the primary rather than a replica. In the end, I decided to restore the latest nightly backup and then had Claude arrange a “swap” where it replaces the current “volume claim” with a pinned “volume” name. Essentially, the database pod has a PVC (persistence volume claim) and I want to have the claim that is used be pointed to the recovered volume. So I had claude execute those steps, which unfortunately can leave you with a PVC in your source code that has a volume reference, which you can get rid of, but may or may not be immediately worth it. I restarted and postgres shows all of the databases that I expect.

Next is to fix redis. It turns out that not only Harbor was using Bitnami helm charts (pre-made configurations for kubernetes), but so was the redis cluster. I run with a main and 2 replicas on the 3 nodes. It was failing because Bitnami no longer wants to provide free charts, so they moved everything to bitnamilegacy. No biggie, I'll just change the image and repository that's used and it'll load. Redis loaded, but then there was another component called “redis-exporter” for metrics that seemed to ignore the image override. I then spent the next few hours trying to get it to work and experimenting with other helm charts that provide a cluster arrangement. I settled on one and got redis working. I did lose some data as some applications like piefed started running and publishing messages that it received to do work from the 3 days of being off-line. I decided not to try to recover that. Oh well, it's only social media. Once I go live there will be more current things to look at. It was a pain, though.

After this, I spent quite a few hours fixing small issues with getting FluxCD to reconcile the state of things, especially since I had made changes to PVCs, which are immutable. That took quite a few more hours to either recreate or undo changes so that FluxCD was happy. Eventually everything came online despite me hitting Docker rate limits. I rebuilt the rest of the various fediverse apps, as I have custom builds for Bookwyrm (books), Piefed (reddit), and Pixelfed (instagram) for my kubernetes cluster.

I then began to rebuild the dashboards that I had lost. I still don't have all of them, but at least now that networking tab show a LOT of devices, including the VLAN. Mission accomplished? I did do one extra and got a log view of long-running queries from different apps that I could annoy the developers with, but they look like some easy fixes with some indexes and light code changes, hopefully.

I still need to rebuild the redis dashboards, as I had some metrics for the different event queues that the apps use, which I could use to monitor is something bad happened. On ocassion, if another server fails to respond, it could cause a queue backup, as I don't believe the varioius apps are “grouping” by domain name, which is a feature with the redis XGROUP command.

Here's a funny thing, though. After getting the services up and running for a couple of days, the RAM usage is the same with 3 control plane nodes as it was with just one, so my worries were for nothing and cost me the cluster.

As part of the recovery, I took the opportunity to create a VIP for talos. This is a static IP address that the different control planes vote on for who is managing. So I changed the talos host from a domain name, such as api.mycluster.com to that IP of 10.132.0.5. I also took the time to migrate from Tailscale's subnet route setup to their operator helm chart. This should let me expose different services over the VPN with a domain name using their MagicDNS system and a meta attribute on the service. I haven't done that yet, though.

This disaster was avoidable and could have been a few minute upgrade if I did everything right, but I was able to take the opportunity to fix some other networking and service issues that I was too afraid to do on a running environment. Now all of my services are communicating over the VLAN, I have a VIP for Talos, Tailscale is upgraded, I've migrated more off of Bitnami, and I can now properly handle a node failure except for full service restarts. I would still have to scale down some things manually for that fail-over. But nobody is making or losing money off of this, except for me and my VPS provider, so good enough.

In the end, I got up and running, and the AI was actually quite helpful for debugging issues and quickly generating commands and templates for volume recovery. It was nice being able to let it either work or run a script to examine the orphan volumes for me. I did have to play around with getting it to create notes to go to new contexts as they would get full quickly once I ran out of Claude usage with my plan. I'm glad I didn't have to type a bunch of stuff myself. Of course, AI is still “that looks about right”, which is a thing that I'm aware of, but it wound up being a useful tool for this recovery.

The other thing that helped a good bit was I was actually in another town to visit an old travel friend. Normally I'm the type of person to obsess about a problem until it's solved, but I was there to visit a friend and nobody's livelihood depends on this. So I pulled myself away to go hang and even after just 15 minutes away from the keyboard I'd start getting new ideas or realizing something new. That's one reason the recovery took several days, because I was still living (and obsessing). The mandatory breaks were probably the most helpful things that I could have done – I just don't know how to replicate those.

#talos #kubernetes #selfhosting #fediverse #keyboardvagabond #whybitnamiwhy #cluster #vps #failover #distasterRecovery

 
Read more...